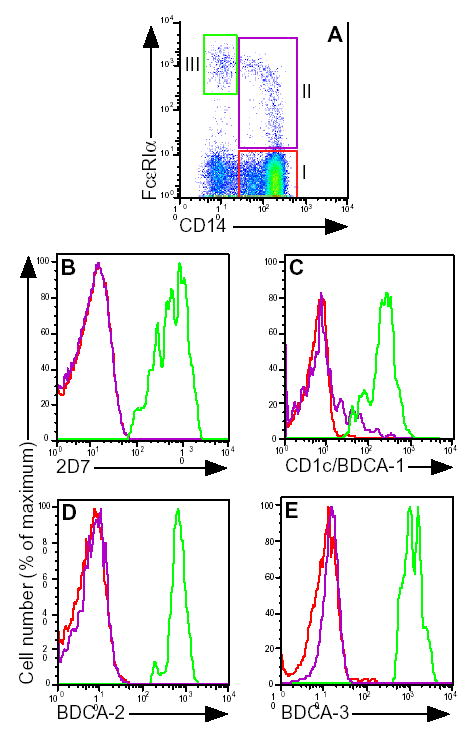
Figure 1. Identification of CD14+, FcɛRIα+ cells as monocytes.

A, after gating on typical monocyte scatter, a CD14 vs. FcɛRI dot plot was generated. Gates for FcɛRI− (I) and FcɛRI+ monocytes (II) and basophils/DC (III) are shown. Expression of B, 2D7; C, CD1c/BDCA-1; D, BDCA-2; and E, BDCA-3, after gating on the FcɛRI− (red histograms) or FcɛRI+ (purple histograms) monocyte, basophil (green histogram in B) or DC (green histograms in C–E) populations. Results shown are representative of 3 non-atopic control and 3 allergic asthmatic subjects.
