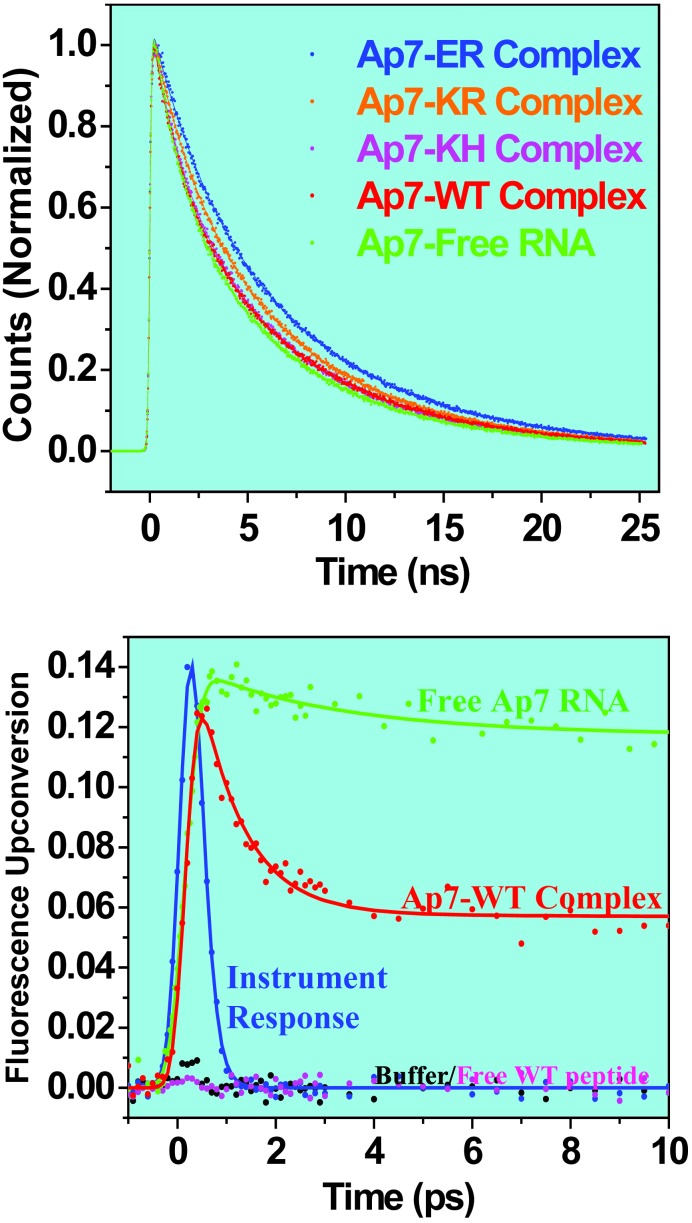
Fig. 2.
(Upper) TCSPC decay profiles for complexes of peptide variants with Ap-7 boxB RNA. All TCSPC decay curves are normalized at time 0 and exhibit multiple exponential nanosecond decay components. (Lower) Fluorescence up-conversion traces for free Ap7 RNA, free WT peptide, and the complex formed (Ap7-WT). The curves are not normalized. Note that the response of the buffer solution or the free peptide shows no transient signal. The instrument response measured by the Raman signal is shown for comparison.

