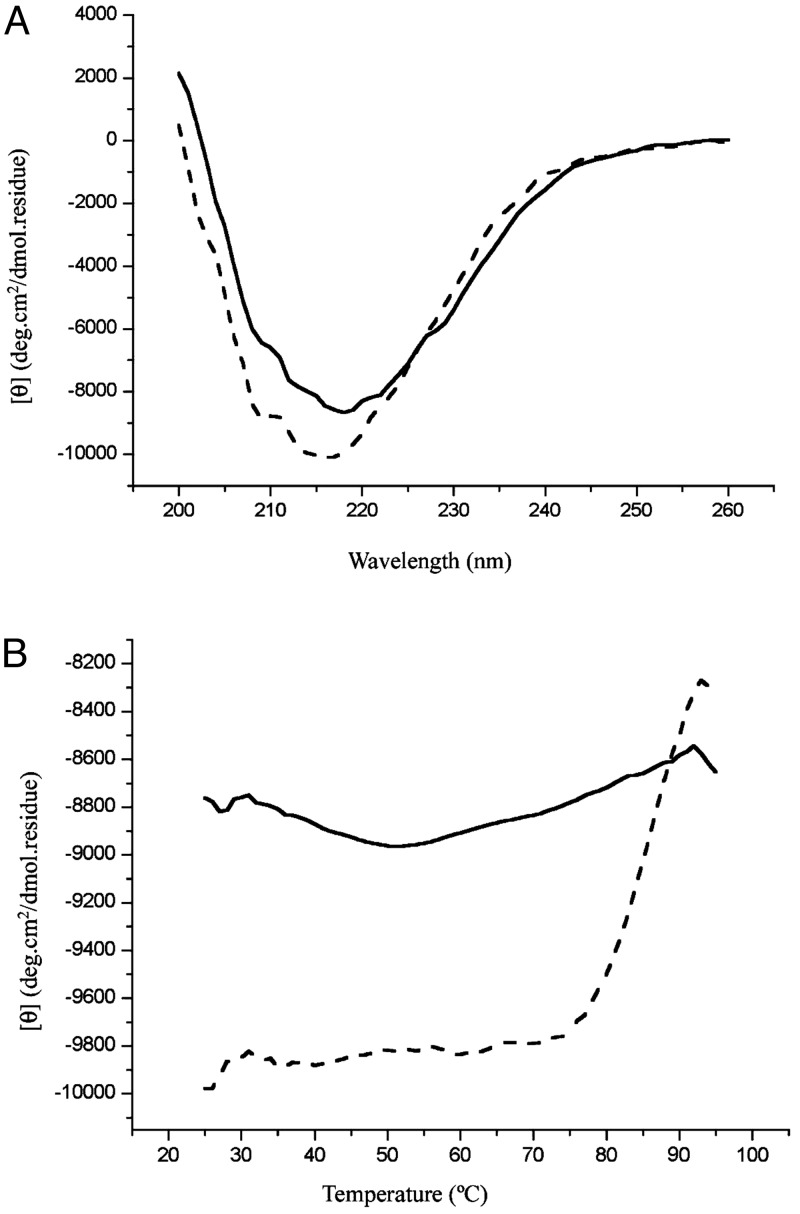
Fig. 6.
CD spectra before and after mixing SCM and Mj HSP16.5. (A) CD spectra of SCM and Mj HSP16.5 at a 1:1 molar ratio at 25°C. Dashed line, before mixing, where two solutions are separated by a divider; solid line, after mixing and heating. (B) Thermal melting of SCM–Mj HSP16.5 at a 1:1 molar ratio. Dashed line, before mixing; solid line, after mixing. The CD signal at 218 nm is plotted as a function of temperature.

