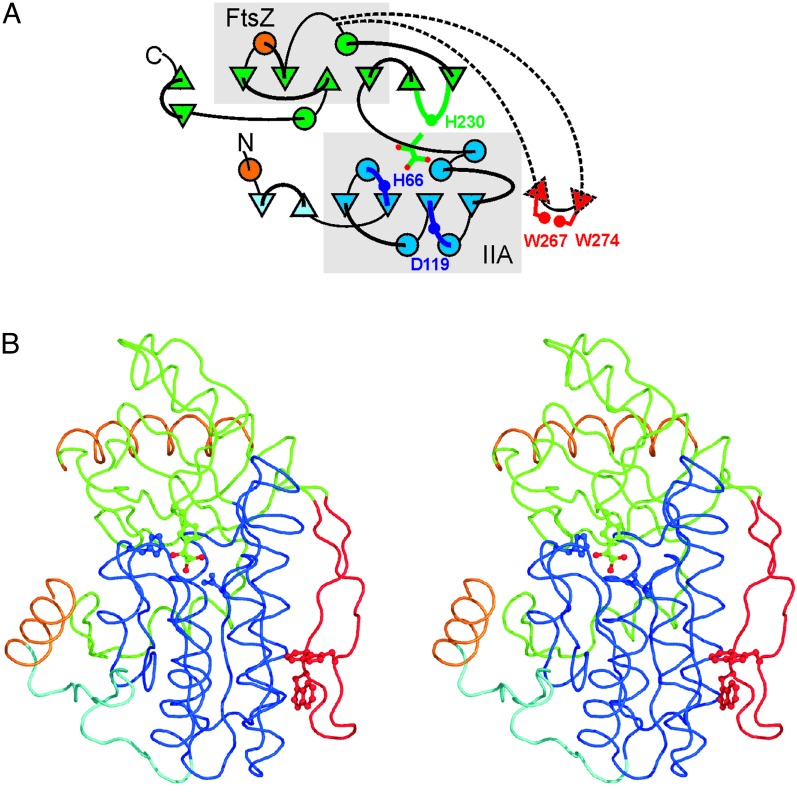
Fig. 2.
Models of DhaK subunit colored by structural entities. (A) Folding diagram. β-strands depicted by a Δ are running downward. For clarity, the folding diagram of the upper sheet has been rotated +60° around an axis perpendicular to the lower sheet. (B) Stereoview of backbone related to Fig. 1 A by a 50° rotation around the horizontal axis. The N-terminal domain is cyan and the IIA core is blue (boxed area), the C-terminal domain is green with the FtsZ core boxed, the β ribbon is red, and contact helices 1 and 8 are orange. The hemiaminal between His-230 and Dha and His-66 and Asp-119 are depicted in the green and blue ball-and-stick representation, and the Trp-267/Trp-274 zipper in the red ball-and-stick representation.

