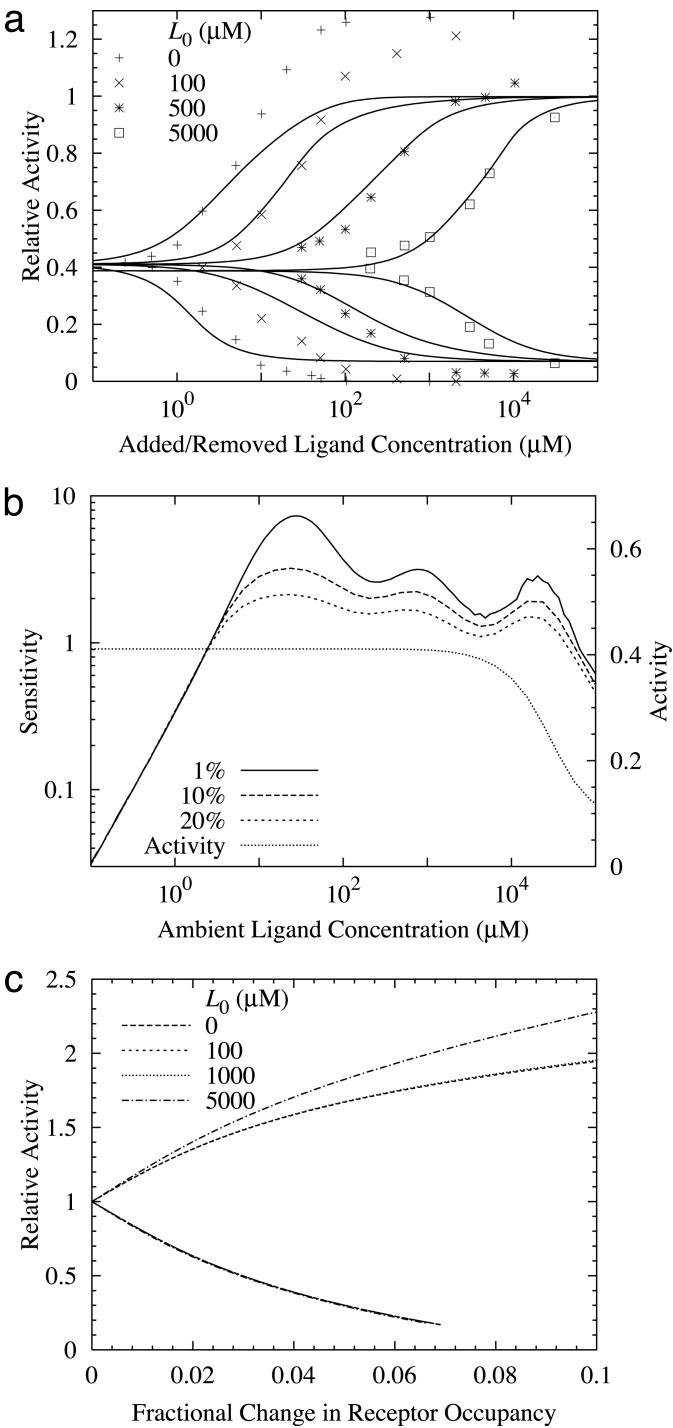
Fig. 2.
(a) The instantaneous response to a sudden change in ligand concentration. Different curves refer to different initial (ambient) MeAsp concentrations (in μM). The horizontal axis is the amount added and then removed. The lower curves are the responses to the ligand increase and the upper curves are the responses to the ligand decrease. (b) The sensitivity and total (steady-state) activity of the wild-type cells at a given MeAsp concentration. The sensitivity is defined as the fractional change in activity divided by the fractional change in MeAsp concentration. The percentages refer to the fractional changes in concentration used in calculating the sensitivity. (c) The fractional change in activity vs. change in (total) ligand occupancy for different initial (ambient) ligand concentrations. The upper and lower curves are for decreasing and increasing ligand concentrations, respectively. The gain is defined as the ratio between the fractional activity change and the change in receptor occupancy. For small changes in receptor occupancy, the gain is ≈20.

