Fig. 1.
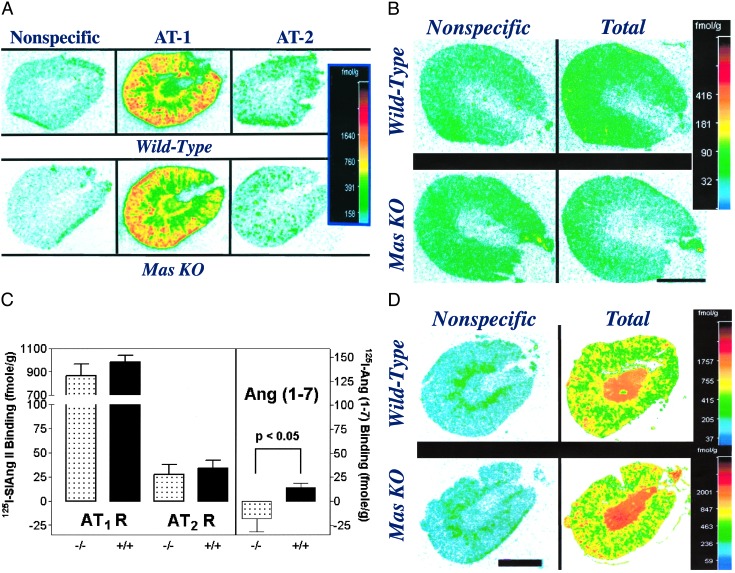
Angiotensin receptor binding in WT and Mas knockout (KO) mouse kidneys. (A) Nonspecific, total AT1, and total AT2 binding of 125I-[Sar-1, Ile-8]Ang II binding in WT (Upper) and Mas-knockout (Lower) kidneys. (B) Nonspecific and total 125I-Ang (1–7) binding in WT (Upper) and Mas-knockout (Lower) kidneys. (C) Specific binding of 125I-[Sar-1, Ile-8] Ang II to AT1 (AT1 R) and AT2 (AT2 R) receptors in WT (+/+) and Mas-deficient (-/-) kidneys (Left) and specific binding of 125I-Ang (1–7) binding to WT (+/+) and Mas-knockout (-/-) kidneys (Right). Bars represent mean of six kidneys ± SEM. (D) Representative autoradiographic localizations of 125I-angiotensin IV binding in WT and Mas knockout mouse kidneys. Color bars (Right)reflect pseudocolor imaging of different levels of exposure of the autoradiogram converted to units of fmol/g as described in Materials and Methods. (Bar = 2 mm.)

