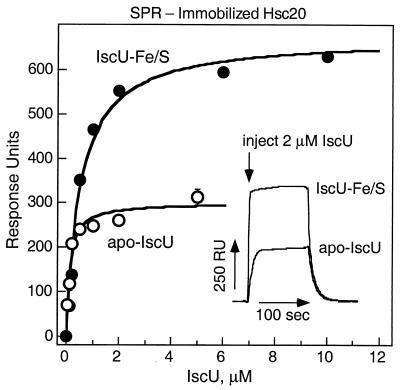
Figure 6.
SPR analysis of the binding of IscU to Hsc20. IscU (○) or IscU–Fe/S (●) was injected into solutions passing over sensor chips containing immobilized Hsc20 (1,200 RU). Curves shown represent best fits to the data with RUmax = 300 and Kd = 0.10 μM for IscU and RUmax = 673 and Kd = 0.54 μM for IscU–Fe/S. Sensorgrams recorded for individual injections from one titration are shown (Inset). A titration of apo-IscU was carried out initially, followed by two sequential titrations of IscU–Fe/S and a duplicate titration of apo-IscU. No decay of the sensor chip was detected, and error bars shown correspond to individual measurements when these fell outside the symbol used.

