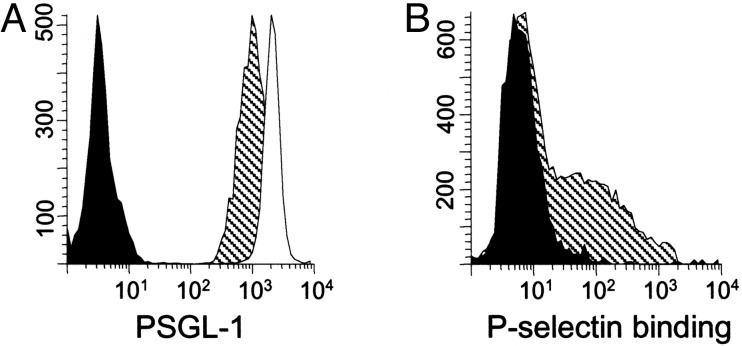
Fig. 5.
(A) All CD4+/CD45RO+ T cells from PB (hatched plot) and CSF (open plot) express PSGL-1. (B) Approximately one-third of CD4+/CD45RA- T cells in PB bound P-selectin in a solution-phase adhesion assay (hatched plot). Filled histogram shows assay performed in the presence of EDTA as negative control.

