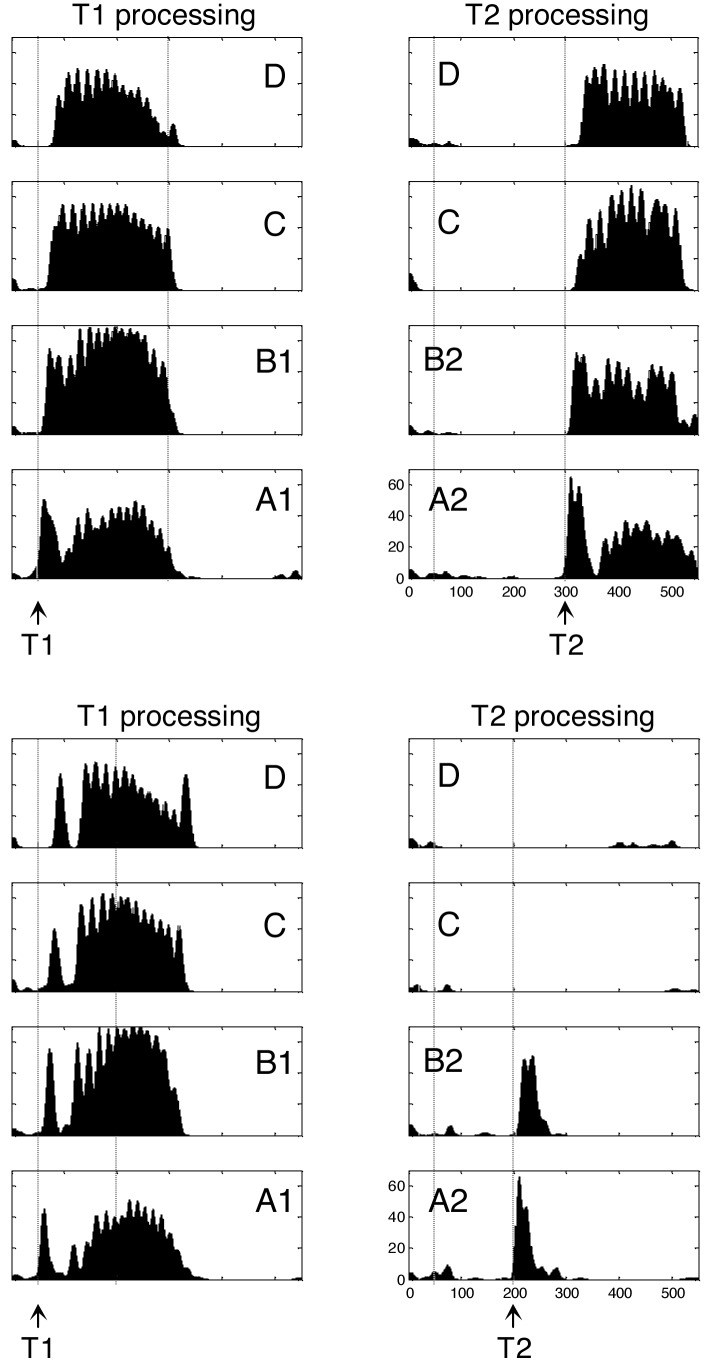
Fig. 2.
Simulation of two trials of the attentional blink task. In each case, boxes show the temporal evolution of firing rate in excitatory cortical neurons within each of the eight columns of Fig. 1B. (Upper) “Seen” trial with long T1–T2 lag (250 ms). T2 is presented at a time when the sustained activity evoked by T1 has decayed. T2 is therefore able to invade all cortical levels and elicits long-lasting activity comparable to T1. (Lower) “Blinked” trial with short T1–T2 lag (150 ms). When T2 is presented during T1-evoked activity, it fails to evoke neural activity beyond an initial bottom-up activation in areas A and B.

