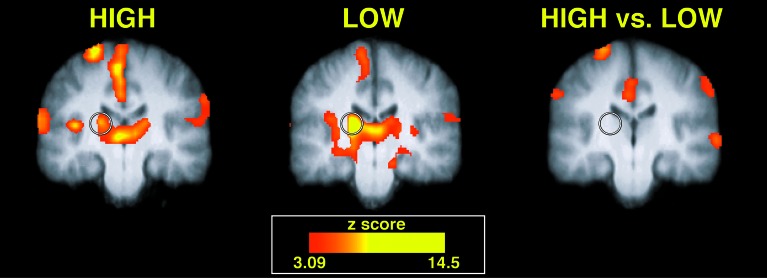
Fig. 3.
Pain-evoked thalamic activation displayed no significant differences between high- and low-sensitivity subgroups. Both high-sensitivity (left image) and low-sensitivity (center image) subgroups exhibited statistically significant activation of the contralateral (left) thalamus (denoted by a circle). Slices are located -20 mm from the anterior commissure.

