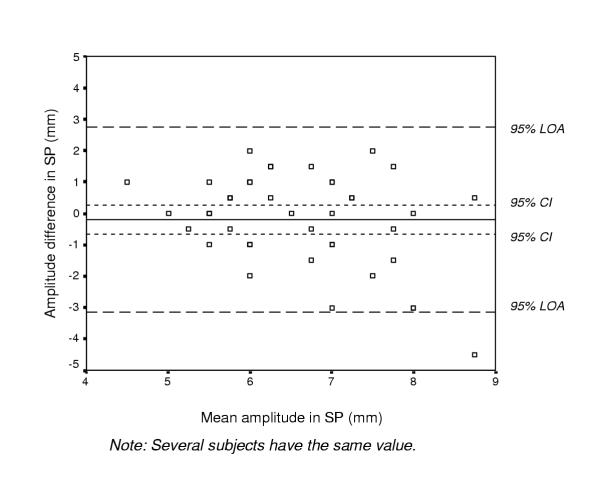
Figure 3.
Bland and Altman graph with limits of agreement (LOA). The differences between test sessions 1 and 2 (test 2 minus test 1) plotted against their mean for each subject for the amplitude in mm in the sagittal plane (SP) in 42 healthy subjects, together with the 95% confidence interval (CI) and the 95% LOA.

