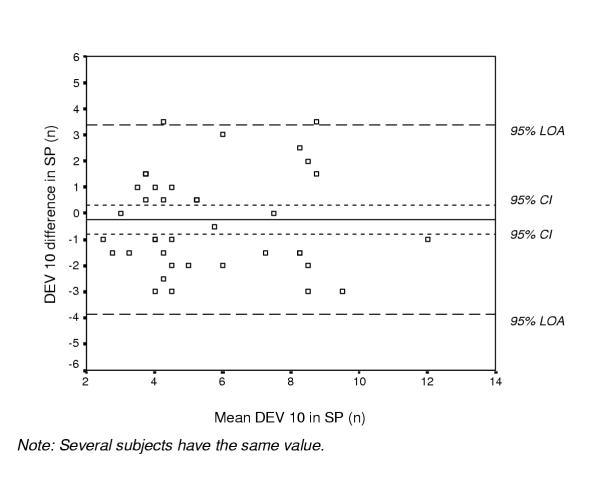
Figure 9.
Bland and Altman graph with limits of agreement (LOA). The differences between test sessions 1 and 2 (test 2 minus test 1) plotted against their mean for each subject for the number of movements exceeding 10 mm (DEV 10) in the sagittal plane (SP) in 42 healthy subjects, together with the 95% confidence interval (CI) and the 95% LOA.

