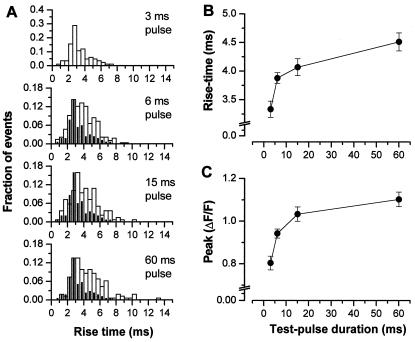
Figure 2.
Histograms of the rise-time of identified Ca2+ sparks recorded during depolarizations of duration 3, 6, 15, or 60 ms. The solid bars in the panels corresponding to the 6-, 15-, and 60-ms depolarizations represent the rise-time distribution of the 3-ms depolarization, scaled to the maximum value of the open-bar distribution, showing the relative increase of sparks with longer rise-times in the longer depolarizations. (B) The mean rise-time. (C) The mean peak amplitude of Ca2+ sparks as a function of the pulse duration. The points represent the mean ± SEM of 83, 276, 138, or 162 sparks (respectively, for 3-, 6-, 15-, or 60-ms pulses) from 11 fibers. Sparks were recorded for two different pulse durations in each fiber. The rise-time distributions were analyzed by a Kolmogorov–Smirnov test (37), which established their non-normality (P < 0.05). Consequently, the rise-times were compared by two nonparametric tests. A Kruskall–Wallis test indicated an overall significant difference between the rise-times of sparks obtained during depolarizations of 3-, 6-, 15-, and 60-ms (P < 10−5), showing that the observed increase in rise-time results from the increase in pulse duration. A Mann–Whitney test was then applied to perform comparisons between groups. The four comparisons (pulse duration 3 ms versus 6, 15, and 60 ms, and pulse duration 6 ms versus 60) were statistically different (P < 0.01). An additional analysis performed on the spark amplitudes gave similar results.

