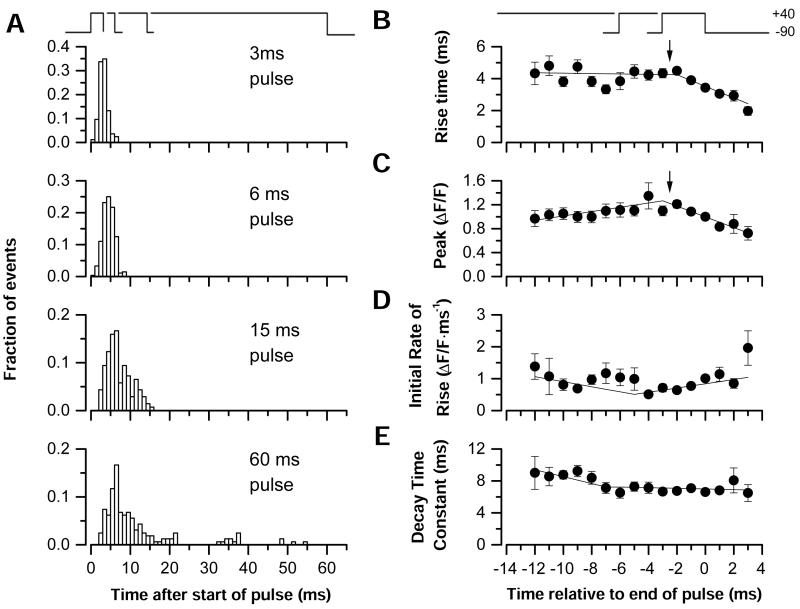
Figure 3.
(A) Latency histograms of identified Ca2+ sparks for depolarizations of 3, 6, 15, and 60 ms. The relative timing of the depolarization is shown at the top, aligned at the rising edge of the pulse. The latency after the start of the depolarization was determined from the fitting procedure to each identified spark (12), (B–E) Mean values of the rise-time (B), peak (C), initial rate of rise (D), and time constant of decline of fluorescence (E) of Ca2+ sparks, plotted as a function of spark latency relative to the end of the depolarization for all pulse durations (3, 6, 15, and 60 ms). The straight line segments in each panel represent the best fit of a function that identified points of inflection in the data. In B and C, this point is indicated by downward arrows. The timing of the depolarizations is shown at the top, now aligned at the falling edge of the depolarization: i.e., the time of repolarization. The points represent the mean ± SEM of values from a total of 550 sparks from 11 fibers, binned in 1-ms intervals for all pulse durations. However, only six sparks from the 60-ms depolarizations are represented because of the relative paucity of sparks occurring late (>48 ms) in this pulse.

