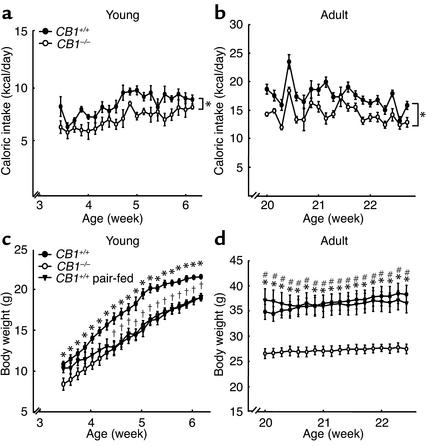
Figure 2.
Food intake and pair-feeding studies in CB1–/– mice. (a) Daily energy intake of young CB1+/+ and CB1–/– mice. Each data point represents mean ± SEM of six mice for each group. *P < 0.05, AUC of caloric intake of CB1–/– mice vs. CB1+/+ littermates. (b) Daily energy intake of adult CB1–/– and CB1+/+ mice. Each data point represents mean ± SEM of six mice for each group. *P < 0.05, AUC of caloric intake of CB1–/– mice vs. CB1+/+ littermates. (c) Body weight curves during pair-feeding in young mice. Each data point represents mean ± SEM of six mice for each group. *P < 0.05 CB1–/– mice vs. CB1+/+ controls; †P < 0.05 pair-fed CB1+/+ mice vs. CB1+/+ controls. (d) Body weight curves during pair-feeding in adult mice. Each data point represents mean ± SEM of six mice for each group.*P < 0.005 CB1–/– mice vs. CB1+/+ controls; #P < 0.005 CB1–/– mice vs. pair-fed CB1+/+ mice. Body weight did not significantly differ between pair-fed CB1+/+ mice and CB1+/+ controls.

