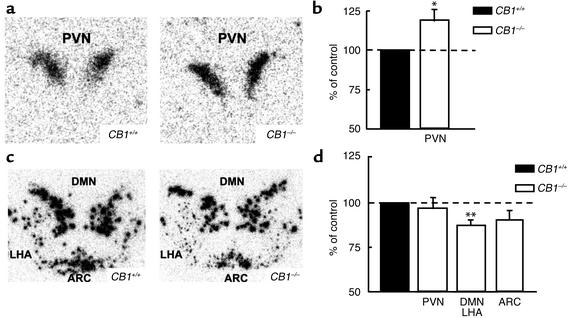
Figure 4.
Altered expression of hypothalamic neuropeptides transcripts in CB1–/– mice. (a) Representative autoradiographic images showing upregulation of CRH mRNA in the PVN of CB1–/– hypothalamus. (b) Densitometric quantification by image analysis of areas of CRH mRNA expression as percentage of control by using four sections from seven animals in each group. *P < 0.05 vs. CB1+/+ control. (c) Representative autoradiographic images showing downregulation of CART mRNA in the DMN, LHA, and ARC of CB1–/– hypothalamus. (d) Densitometric quantification by image analysis of areas of CART mRNA expression as percentage of control by using four sections from seven animals in each group. **P < 0.005 vs. CB1+/+ control.

