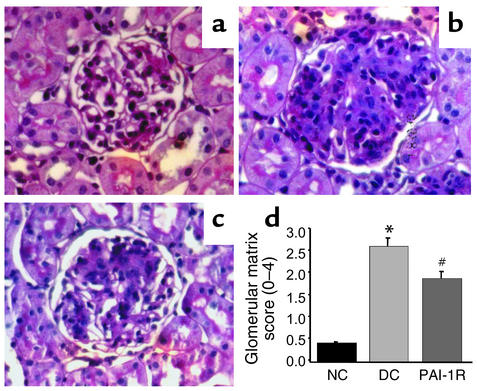
Figure 5.
Glomerular histology. Representative photomicrographs of glomeruli from normal control rats (a), disease control rats treated with PBS (b), and PAI-1R–treated, nephritic rats (c) at d6. (d) Graphic representation of PAS staining scores of each group. PAI-1R treatment resulted in a significant reduction in PAS staining score compared with disease control rats. *P < 0.001 vs. normal control; #P < 0.02 vs. disease control.

