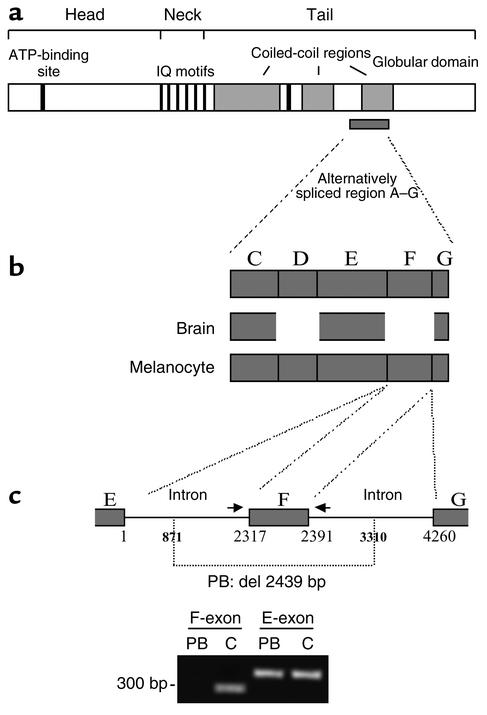
Figure 6.
Characterization of the MYO5A mutation in PB. (a) Schematic representation of MyoVa with the details of the various domains as previously reported (9) and of the alternatively spliced A–G region. (b) Schematic representation of the alternative splice forms expressed in melanocyte and brain tissues. (c) Deletion 871–3310 in PB’s MYO5A gene disrupts the F-exon as well as its 5′ and 3′ flanking intronic sequences. Number 1 of the base pair corresponds to the first base of the 5′ F-intron sequence. PCR amplification of the E- and F-exons in PB and control (C) is shown. Primer pairs used (indicated by arrows for the F-exon) were previously described (9).

