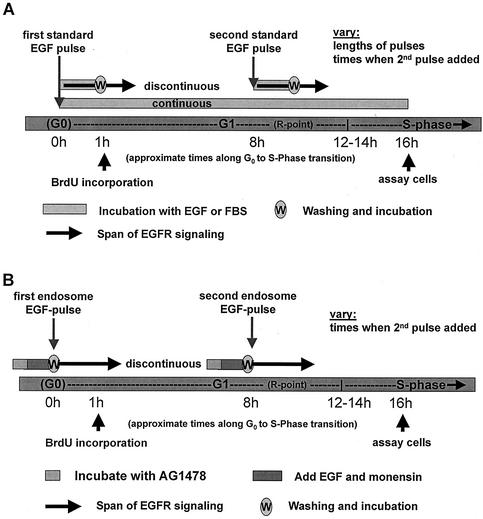
FIG. 2.
Schematics of the two treatment assays employed. (A) Schematic of the continuous and discontinuous EGF stimulation assays employed. For discontinuous treatment, “w” indicates washout of unbound ligand, and solid arrows imply a continuation of signaling (from internalized receptors) after growth factor is removed from the medium. (B) Schematic of the (discontinuous) endosome-associated EGFR stimulation assay employed. For each endosome EGF pulse, the gray bar represents preincubation with AG1478, the red bar indicates incubation with EGF with or without monensin, and “w” indicates washout of AG1478 and thus the onset of endosome EGFR activation. Solid arrows imply the extent of actively signaling EGFR following this wash step.

