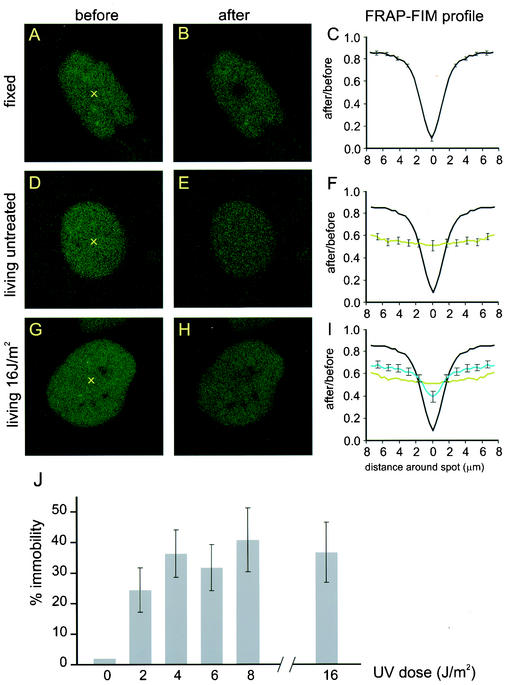
FIG. 4.
FRAP-FIM method applied to GFP-XPA-expressing cells. Shown are confocal images and corresponding fluorescence ratio profiles (FRP) of 50 cells. (A and B) Pre- and postbleach images, respectively, of cells fixed with 2% paraformaldehyde, displaying the immobilization of GFP-XPA molecules after fixation, visualized by the intense bleached spot and high fluorescence intensity outside the bleached spot (B). (C) FRP of fixed cells. (D and E) Images of living untreated cells, showing an overall reduction of fluorescence after the bleach pulse (E). (F) FRP of untreated cells (green line). (G and H) Image of cells irradiated with 8-J/m2 UV-C. The UV-irradiated cell (H) displays a distribution pattern intermediate of those of untreated (B) and fixed (E) cells. The “X” in panels A, D, and G represents the position of the bleach pulse. (I) FRP of UV-irradiated cells (blue line). (J) Response of GFP-XPA immobilization to different UV doses.

