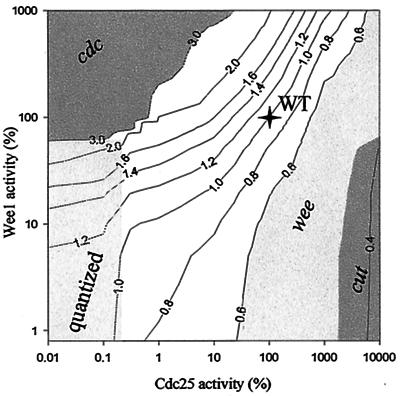
Figure 6.
Effects of Wee1 and Cdc25 activities on BL and phenotype of fission yeast. Curves represent cells of constant BL (BL = 1.0 for WT cells). The shaded regions represent different phenotypes. Both enzyme activities are expressed as percentage of WT. For Wee1 (ordinate), we varied only the large turnover number (VWee), leaving the small one (Vwee′ ) unchanged. For Cdc25, we varied both (V25′ and V25), keeping their ratio the same as in WT.

