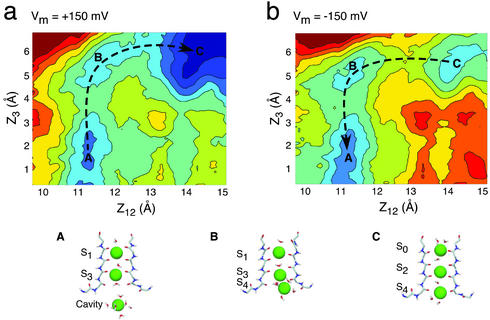
Fig. 2.
The total multiion free-energy profile Wtot(Z1, Z2, Z3) including the equilibrium PMF calculated from MD and a transmembrane voltage of ±150 mV. Wtot(Z1, Z2, Z3) is obtained from Eq. 2 by using the transmembrane potential profile shown in Fig. 1. The 2D projection maps were calculated as a function of the reduced reaction coordinates (Z1+Z2)/2 and Z3 (the ions are numbered from 1 to 3 starting from the extracellular side; see ref. 5). Each color contour corresponds to 1 kcal/mol. The dominant mechanism for outward (+150 mV) (a) and inward (–150 mV) (b) ion movements are indicated with dashed arrows. The principal ionic configurations along the conduction pathways are illustrated: A, [Cavity, S3, S1]; B, [S4, S3, S1]; C, [S4, S2, S0].

