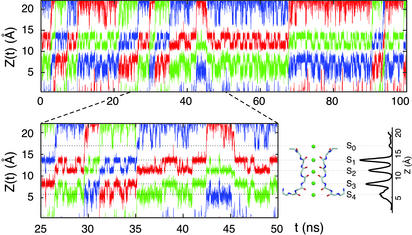
Fig. 3.
Typical BD trajectory generated with an applied membrane potential of +50 mV and under symmetric conditions of K+ concentration chosen to yield a channel occupied by three ions 50% of the time. The Z(t) of the two or three ions in the system is alternatively plotted in blue, red, and green for the sake of clarity. The relative ion density along the pore is shown in relation to the different binding sites. Many outward translocation events can be observed; for example, the red curve shows some of these events between 5 and 10, 25 and 30, 35 and 45, and 90 and 95 ns. A reentry of a translocating ion in the direction opposite to the transmembrane potential can be observed between 45 and 68 ns. Binding of an ion from the extracellular solution briefly to site S0 stabilizes ions in sites S2 and S4 (e.g., around 48 ns).

