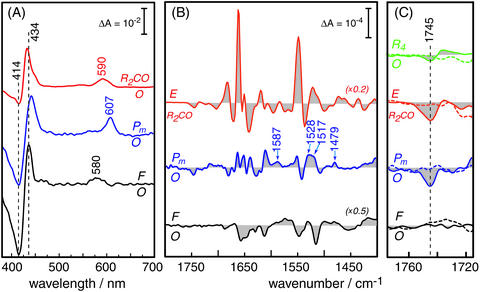
Fig. 3.
Difference spectroscopy of the reaction intermediates of CcO. (A)
Absorption difference spectra in the visible wavelength range. The
two-electron reduced CO-bound state (R2CO) was generated by
bubbling CO through a detergent solubilized solution of CcO. The visible
spectrum (red trace) exhibits characteristic maxima at 590 nm of the
α-band and at 432 nm in the Soret region. The shoulder on the latter
band at 448 nm indicates some overreduction after the time-resolved IR
experiments. Pm was created by applying a saturated solution of
equimolar amounts of CO and O2 to a protein–lipid film
adhered to the inner surface of a quartz cuvette. The corresponding difference
spectrum (Pm-O, middle trace) shows positive bands at 437 and 607
nm. F was established by the action of H2O2 on the
protein-lipid film. The F-O difference spectrum (black trace, bottom) shows
characteristic maxima at 434 and 580 nm. (B) Infrared spectra of CcO
from R. sphaeroides, showing the E-R2CO (red trace, top),
Pm-O (blue trace, middle), and F-O (black trace, bottom)
differences. (C) Enlarged view (×10) of the difference bands of
wild-type CcO in the region where carbonyl vibrations of protonated carboxylic
acids are expected. The dashed spectra are the corresponding spectra of the
E286D mutant measured under identical conditions. The dashed vertical line
indicates the frequency of the  stretching vibration of the carboxylic
acid side chain of E286. For comparison, the change in the carbonyl stretch of
E286 in the transition from the oxidized to the fully reduced state
(R4-O) is shown in green [top traces; the fully reduced state has
been prepared as published
(20) but at pH 8.5].

