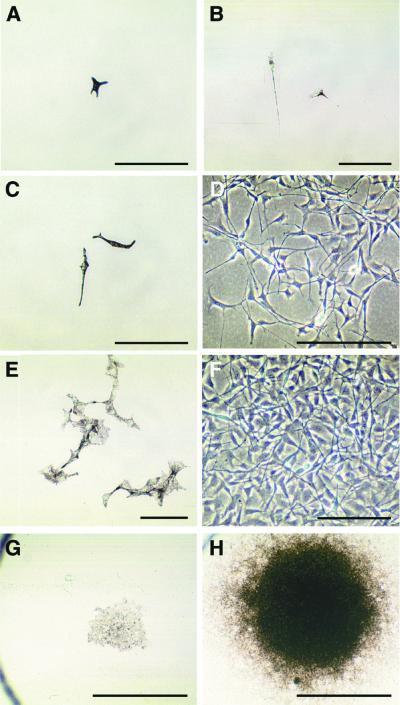
Figure 4.
Growth of single pigment cell cultures. Microscopic views of pigment cell colonies grown in the presence (right panels) or absence (left panels) of 50 nM ET3. (A) A pigment founder cell in d1 control culture. (B) At d1 in presence of ET3, the clonogenic cell has divided once. (C and D) At d5, untreated and treated cultures show striking differences in pigmentation and proliferative activity. (E and F) At d9, small clones of pigment cells formed in control medium (E) whereas proliferating ET3-treated cells became unpigmented (F). (G and H) Low magnification of d13-colonies showing one of the largest clones recorded in control cultures (G) and a typical large dense clone of highly pigmented cells in treated cultures. (A–C, E, G, and H) Bright-field. (D and F) Phase-contrast. [Bars = 100 μm (A–F) and 1 mm (G and H).]

