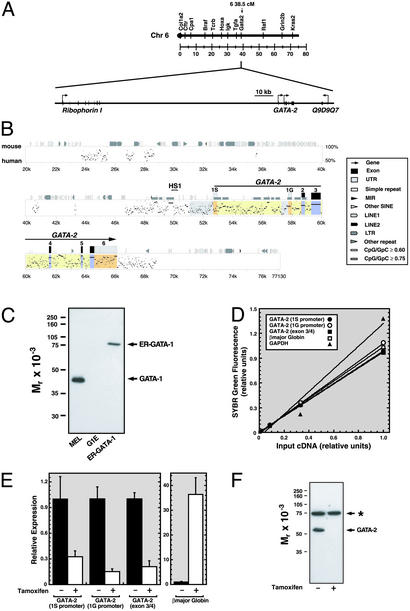
Fig. 1.
GATA-1-dependent repression of transcription from 1S and 1G GATA-2 promoters. (A Upper) Linkage map showing location of murine GATA-2 on chromosome 6. (A Lower) Map showing 150 kb surrounding GATA-2 including the 5′ flanking gene Ribophorin I and the putative 3′ flanking gene Q9D9Q7. (B) pipmaker (76) alignment of a 77-kb region of the mouse and human GATA-2 domains. Shaded regions indicate the following: promoters, gray; untranslated regions, orange; exons, blue; introns, yellow. HS1 denotes a DNaseI hypersensitive site mapped previously (71). (C) Western blot analysis of GATA-1 and ER-GATA-1 expression with anti-GATA-1 antibody in whole-cell lysates from DMSO-induced MEL cells, G1E, and G1E-ER-GATA cells after a 20-h treatment with 1 μM tamoxifen. (D) SYBR green fluorescence (relative units) was plotted versus the initial G1E input cDNA concentration. The plot illustrates the linearity and range of signals used to measure target cDNA. (E) Quantitative real-time RT-PCR analysis of GATA-2 mRNA expression in untreated and tamoxifen-treated (48 h) G1E-ER-GATA cells. Primers amplified transcripts transcribed from the 1S promoter, the 1G promoter, and from both promoters (exon 3/4). β-Globin expression was measured as a control. Relative expression levels were normalized by GAPDH expression (mean ± SEM; five independent experiments). (F) Western blot analysis of GATA-2 expression in untreated and tamoxifen-treated (24 h) G1E-ER-GATA cells. The asterisk denotes a broadly expressed crossreactive band.

