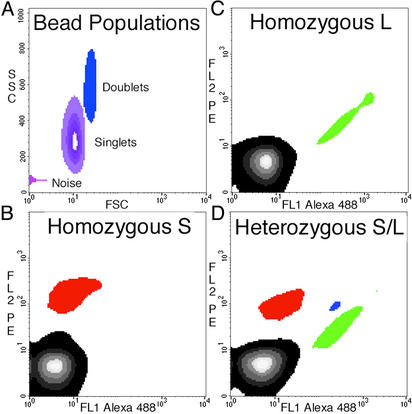
Fig. 3.
Density plots of flow-cytometric data obtained from BEAMing. The locus queried in this experiment was MID42, and PCR products generated from genomic DNA were used as templates in the microemulsions. (A) Forward scatter (FSC) and side scatter (SSC) of all beads show that ≈80% of the total beads are singlets, with most of the remaining beads aggregated as doublets. The “noise” is instrumental and is observed with blank samples containing no beads. The instrument output was gated such that only singlets were analyzed for fluorescence analysis. The patterns observed from an individual homozygous for the L allele (A), homozygous for the S allele (B), and heterozygous for L and S (D) are shown in B–D, respectively. The regions containing beads hybridizing to the L and S allele probes are labeled green and red, respectively. The region containing beads that did not hybridize to any probe is black, and the region containing beads that hybridized to both probes is blue. The blue beads arose from aqueous compartments in which both types of template molecules were present. The proportion of singlet beads that hybridized to at least one of the probes was 2.9%, 4.3%, and 20.3% in B–D, respectively. The forward-scatter and side-scatter plots in A represent the same beads analyzed in D. FL1, fluorescent channel 1; FL2, fluorescent channel 2; PE, R-phycoerythrin.

