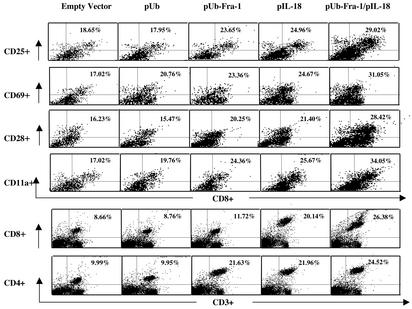
Fig. 4.
Up-regulated expression of T cell activation molecules. Two-color flow cytometric analyses were performed with single-cell suspensions of splenocytes obtained from immunized mice. Anti-CD25, CD69, CD28, and CD11a Ab were used in PE-conjugated form in combination with FITC-conjugated anti-mouse mAb directed against CD8+ T cells. PE-labeled anti-CD8 and anti-CD4 Abs were used in combination with FITC-conjugated anti-mouse mAb CD3. Each value represents the mean for four mice. Differences between the two control groups (empty vector and Ub) were statistically significant when compared with the three treatment groups (P < 0.05).

