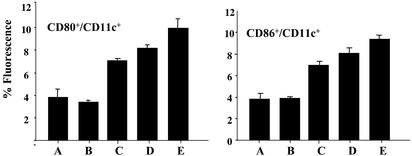
Fig. 6.
Up-regulation of costimulatory molecules by DNA vaccine. In the same experiment as that depicted in Fig. 4, two-color flow cytometric analyses were performed with single-cell suspensions prepared from mouse splenocytes obtained 30 d after tumor cell challenge. Splenocytes were stained with FITC-labeled anti-CD11c Ab in combination with PE-conjugated anti-CD80 or CD86 Abs. Shown is the percent fluorescence of cell surface expressions of these two costimulatory molecules in each group (n = 4) (mean + SD). Differences between the two control groups (A and B) and the three treatment groups (C–E) were statistically significant (P < 0.05).

