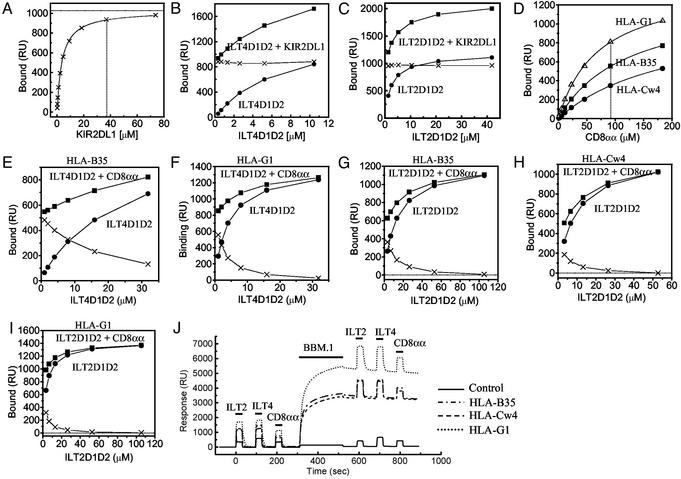
Fig. 2.
The effect of KIR2DL1, anti-β2m mAb (BBM.1), or CD8αα on the binding of a soluble ILT2 and ILT4 to MHCIs. (A) Equilibrium binding analysis of KIR2DL1 against HLA-Cw*0401 (Kd ≈ 3.3 μM) on the same sensor chip used in the experiments shown in B and C. The estimated saturation level of KIR2DL1 was calculated by nonlinear curve fitting [1,026 response units (RU)]. (B and C) Binding of ILT4D1D2 (B) and ILT2D1D2 (C) (filled circles) alone or mixed with KIR2DL1 (filled squares). The concentration of KIR2DL1 was 38 μM (A, dotted line). The difference in the binding seen with or without KIR2DL1 was plotted (crosses). (D) Equilibrium binding analysis of CD8αα against HLA-B*3501 (squares), HLA-Cw*0401 (circles), and HLA-G1 (upward triangles) on the same sensor chip used in the experiments shown in E–I. The Kd values are listed in Table 1. (E and F) Binding of ILT4D1D2 with or without CD8αα to HLA-B*3501 and HLA-G1, respectively. The concentration of CD8αα was 92 μM(D, dotted line). The difference in the binding seen with or without CD8αα was plotted (crosses) in the experiments shown in E–I.(G–I) Binding of ILT2D1D2 with or without CD8αα to HLA-B*3501 (G), HLA-Cw*0401 (H), and HLA-G1 (I). The concentration of CD8αα was 92 μM. (J) Binding of ILT2D1D2 (105 μM), ILT4D1D2 (33 μM), and CD8αα (92 μM) before and after injection of anti-β2m BBM.1 mAb to saturation level.

