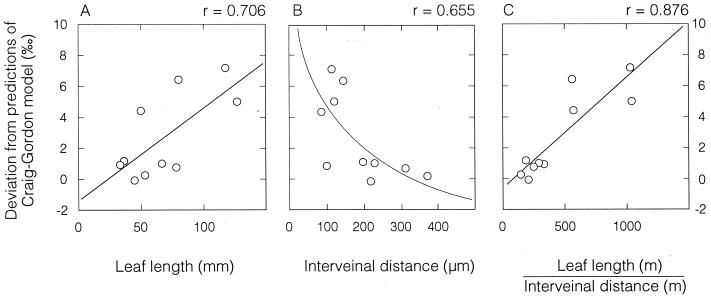
Figure 1.
The relationships between δ18Owl residuals (difference between the observed and predicted δ18Owl values) versus grass leaf morphological characteristics. (A) Residual versus leaf length (P < 0.01). (B) Residual versus interveinal distance (P < 0.01). (C) Residual versus leaf length divided by interveinal distance (P < 0.001). Each point represents a different grass species and is the mean of three plants.

