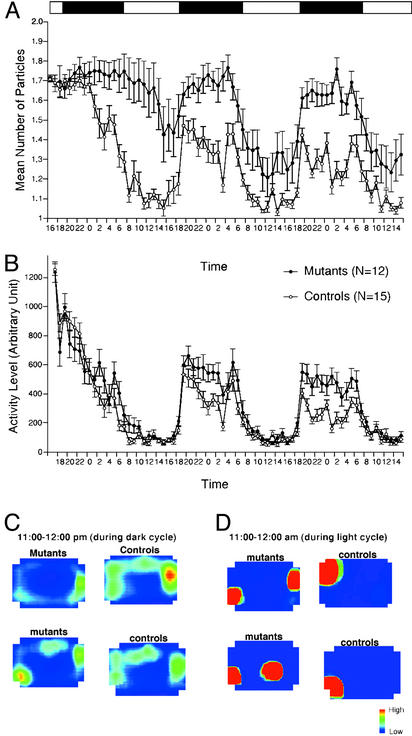
Fig. 2.
Decreased social interaction in home cage. Number of particles in home cage (A), an index of social activity, and activity level (B) are shown. (C and D) All frames taken during an hour were averaged. Control and CN mutants were active during the dark cycle (C; 11:00 p.m. to 12:00 p.m.). During the light cycle (D; 11:00 a.m. to 12:00 a.m.), control and CN mutants were inactive. During inactive periods, control mice stayed in contact with their cage mates, whereas mutant mice tended to stay separated from each other.

