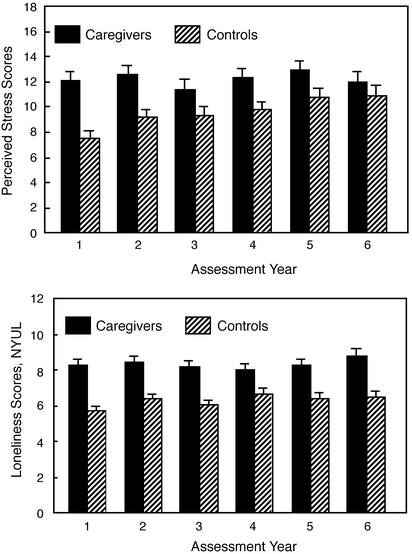
Fig. 2.
Group differences in perceived stress scores (Upper) and loneliness [New York University Loneliness Scale (NYUL); Lower] by year. Caregivers consistently reported more stress, with group differences that were P = 0.05 or larger for all but year 6, with 1–6, respectively: t(157) = 4.70, P < 0.001; t(178) = 3.69, P < 0.001; t(165) = 1.98, P = 0.05; t(169) = 2.56, P = 0.01; t(168) = 2.01, P = 0.046; and t(143) = 0.97, P = 0.33. Similarly, caregivers consistently reported higher loneliness, with significant differences across all 6 years of the study, with 1–6 respectively: t(137) = 5.50, P < 0.001; t(167) = 4.84, P < 0.001; t(153) = 4.58, P < 0.001; t(169) = 3.02, P = 0.003; t(161) = 4.04, P < 0.001; and t(135) = 4.34, P < 0.001.

