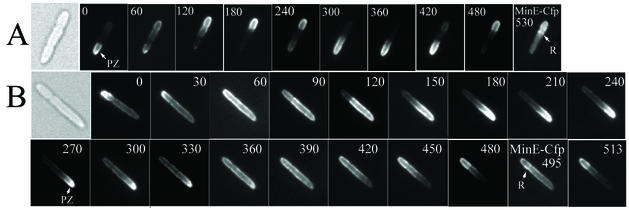
FIG. 3.
Oscillation of Yfp-MinD in living cells. Time lapse fluorescence micrographs of Yfp-MinD in strain RC1 containing pYLS68 (Plac- yfp::minD minE::cfp) (A) and pYEC22S (Plac-yfp::minD minEL22S::cfp) (B). The time at which the image was acquired (in seconds) is indicated in each micrograph. The cells were observed at 15-s intervals between micrographs to confirm that no dramatic change occurred during the intervals. In one image in each panel, as indicated, fluorescence from MinE-Cfp was captured. The arrows indicate the MinE ring (R) and the MinD polar zone (PZ).

