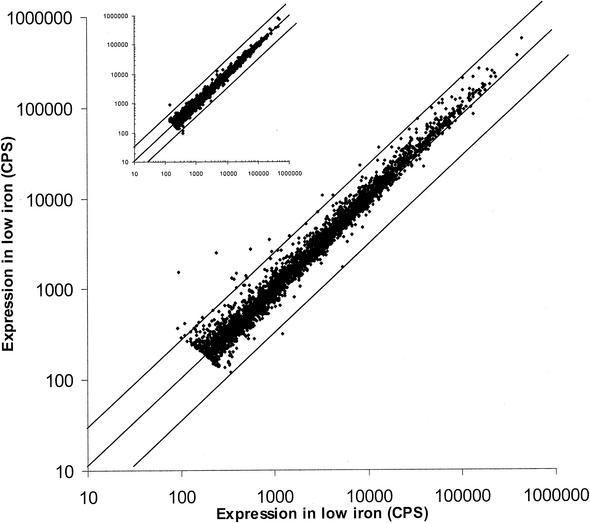
FIG. 2.
Scatter plot analysis of duplicate screens under low-iron conditions. Luminescence readings were taken at 6 and 20 h (inset). The lines demarcate the threefold differences in expression level. The linear trend for the duplicate data points indicates that plate-to-plate variability is minimal. Points falling outside the threefold range (3% of data points) can most likely be attributed to growth effects arising from variation in inoculum. Promoter clones with expression levels below or equal to background were not included in the data set.

