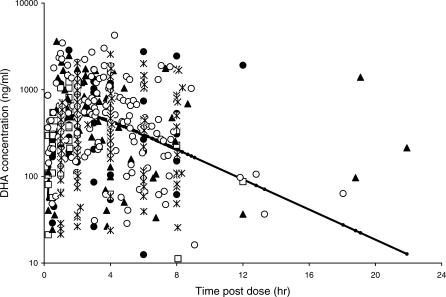
Figure 2. Observed and Population Predicted Concentrations (Solid Black Line) of DHA (Semilogarithmic Scale; ng/ml) versus Time post Dose (h).
Study site: filled circle, Bangkok; open square, Ghana; filled triangle, Mae-Sot; open circle, Malawi; asterisk, South Africa.
The population predicted concentrations are calculated for a dose of 10 mg/kg.

