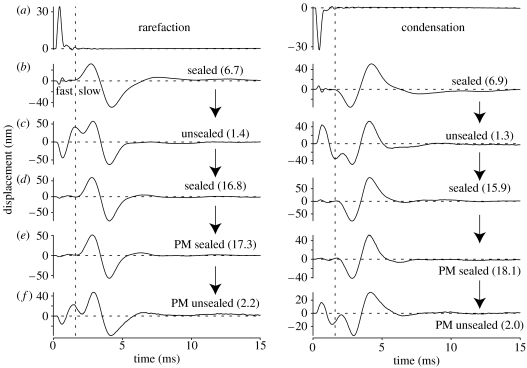
Figure 5.
Responses to rarefaction and condensation clicks in one cochlea (ub050). (a) Responses recorded from the incus. (b–f) Responses from a small cluster of HCs under different hydraulic and physiological conditions. The apical cochlea was initially (b) sealed, (c) became unsealed and (d) was re-sealed using a new cover-slip. Post-mortem (PM) measurements were then made under (e) sealed conditions before the cover-slip was dislodged manually to obtain the final (f) unsealed waveforms. The vertical dashed lines mark the onset of the major HC response component under sealed cochlear conditions. These lines serve as a boundary to separate the ‘fast’ and ‘slow’ components of each response, despite the fact that the components overlap when the cochlea is unsealed (see text). The numbers in parentheses alongside each waveform indicate the ratio of the peak-to-peak amplitudes of the response components occurring on either side of the vertical line (i.e. the slow component's peak-to-peak amplitude divided by the fast component's peak-to-peak amplitude). Peak-equivalent stimulus levels=80 dB SPL. Responses averaged 250×. The RM was intact during all measurements.

