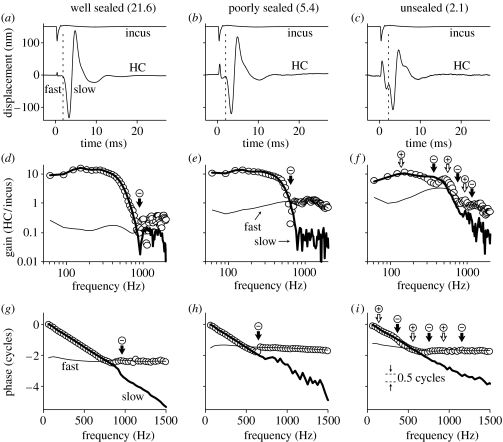
Figure 6.
Frequency-dependent interactions between ‘fast’ and ‘slow’ response components in one cochlea (wu126). (a–c) HC and incus responses to rarefaction clicks under three different sealing conditions, as labelled. Vertical dashed lines are used to separate each HC response into fast and slow components. The numbers in parentheses above each panel indicate the ratio of the peak-to-peak amplitudes of the fast and slow HC response components (i.e. the slow component's peak-to-peak amplitude divided by the fast component's peak-to-peak amplitude). (d–f) Amplitude transfer functions derived from data in (a–c), respectively. The fast and slow components (thin and bold solid lines, respectively) were analysed after separating the responses in the time-domain using a 720 μs wide raised-cosine ramp function centred on the dashed lines in (a–c). The transfer functions for the complete time-domain responses are shown as open circles. (g–i) Corresponding phase transfer functions. The fast component phases have been offset by either 1.0 or 2.0 cycles to facilitate their comparison with the complete phase transfer functions (open circles). The arrows in (d–i) indicate a selection of frequencies where the fast and slow components occur exactly in-phase (+, open arrows) or in anti-phase (−, solid arrows). Peak-equivalent stimulus levels=80 dB SPL. Responses averaged 250×. The RM was intact during all measurements.

