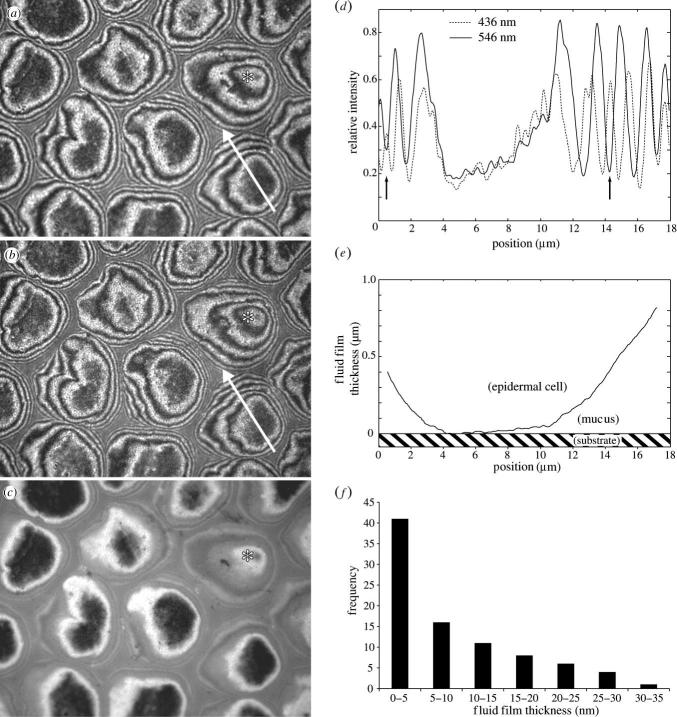
Figure 2.
In vivo analysis of Litoria caerulea toe pad contact with glass using interference reflection microscopy (IRM). (a–c) Corresponding images of the same area of the contact zone taken using different wavelengths and illuminating numerical apertures (INA): (a) 546 nm, INA=0.27, (b) 436 nm, INA=0.27, and (c) 546 nm, INA=1.27. Note the hemidesmosome pegs visible as dark spots in the central cell areas. Asterisks denote one epidermal cell, which is not in close contact (h≥40 nm) and has a convex shape. (d), Intensity profile along the arrow shown in (a) and (b). Arrows indicate the position of the second order ‘green’ minimum coinciding with the second order ‘blue’ maximum. (e) Reconstruction of the fluid film thickness along the arrow shown in (a) and (b) (see appendix B). (f) Frequency of measured fluid film thicknesses in hexagons with zero order minimum (n=87 from five frogs).

