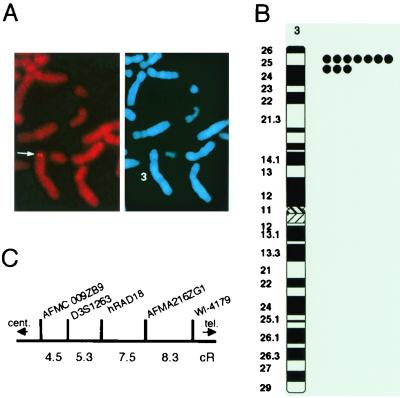
Figure 2.
Chromosomal localization of the hRAD18 gene. (A) An example of FISH mapping, showing the FISH signals on chromosome 3 (Left). The same mitotic figure was stained with 4′,6-diamidino-2-phenylindole to identify chromosome 3 (Right). FISH was performed by using normal human lymphocytes and a 2.8-kb cDNA for hRAD18 as a probe according to standard procedures (See DNA Biotech, Ontario, Canada). (B) Diagram of FISH mapping. Each dot represents the FISH signals detected on human chromosome 3. (C) Chromosome mapping by PCR with a radiation hybrid panel. PCR was carried out as described in Materials and Methods. The results of PCR patterns were analyzed at the Whitehead Institute/MIT Center for Genome Research (Cambridge, MA).

