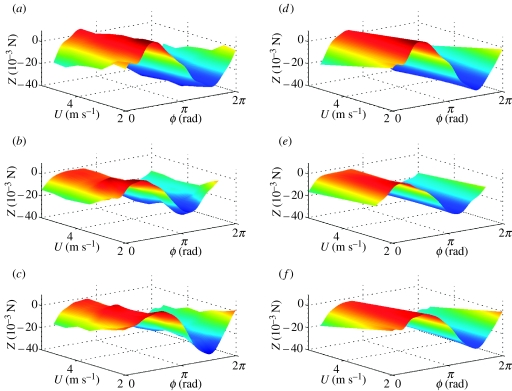
Figure 5.
Surface plots of Z force, reconstructed from Fourier series analysis as functions of flight speed U and phase ϕ through wing beat. (a–c) Forces reconstructed from Fourier series GLM fitted separately for each flight condition; (d–f) linearized approximation thereof from single Fourier series GLM. The three rows correspond to data from locusts R, G and B, respectively. The same look-up table is used to plot colour as a function of Z within a row, but look-up tables vary among rows.

