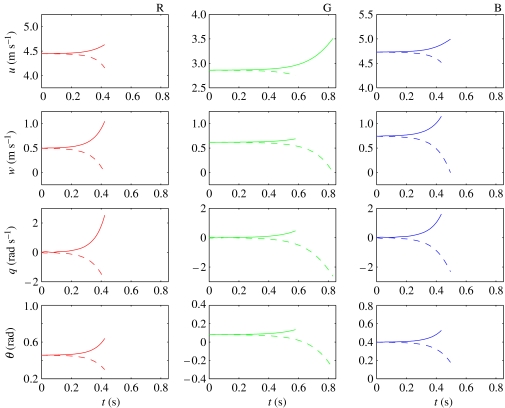
Figure 8.
Numerical solutions to the NLTI models for locusts R (red), G (green) and B (blue), with initial conditions , q0=0, and . The solutions for (dashed lines) tend to diverge more slowly than those for (solid lines). The solutions are only plotted for as long as the speed remains within the range 2.0 m s−1≤U≤5.5 m s−1 and the body angle remains within the range 0°≤α≤14°. These ranges correspond to the range of flight conditions over which the forces were measured in the experiments by Taylor & Thomas (2003), and to which the empirical models of force production are fitted.

