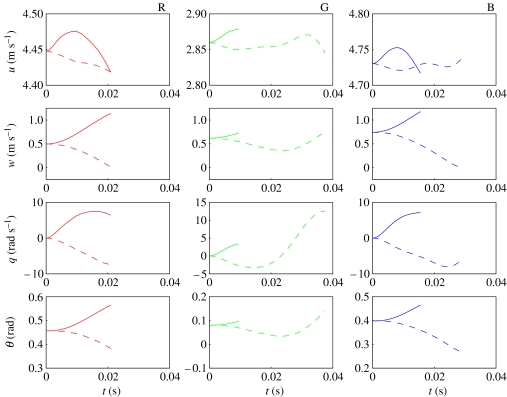
Figure 9.
Numerical solutions to the NLTP models for locusts R (red), G (green) and B (blue), with initial conditions , , q0=0, and t0=0 (solid lines), or t0=π/ω (dashed lines). Note that forcing excites the systems' instability so, in contrast to the corresponding plots for the NLTI models (figure 8), no initial disturbance needs to be applied to excite the systems. The solutions are only plotted for as long as the speed remains within the range 2.0 m s−1≤U≤5.5 m s−1 and the body angle remains within the range 0°≤α≤14°. These ranges correspond to the range of flight conditions over which the forces were measured in the experiments by Taylor & Thomas (2003), and to which the empirical models of force production are fitted.

