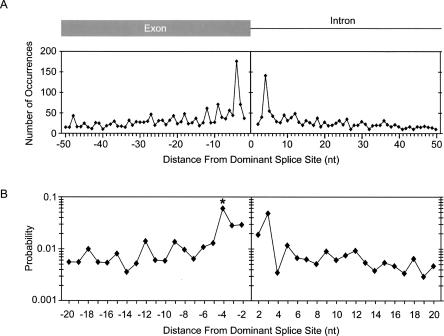
FIGURE 1.
Distribution of alternative 5′-splice sites relative to the dominant splice site. (A) The frequency of alternative 5′-splice-site activation is shown in nucleotide resolution. The Y-axis indicates the number of alternative splice sites. The X-axis indicates the nucleotide distance between alternative and dominant splice sites. Alternative 5′-splice sites upstream from the exon/intron boundary are denoted as negative, those downstream are positive. (B) The probability that a GU is activated as an alternative 5′-splice site is plotted as a function of nucleotide distance from the dominant splice site. Each point was calculated by dividing the number of alternative splice-site usage events at a particular distance from the dominant splice site by the total number of times GU occurs at that same distance from splice sites within the human genome (∼125,000 exons). The Y-axis is shown in log scale. The asterisk at the −4 position denotes that the probability calculation at this position does not include the probability of 0.016 that a GC dinucleotide is used as a splice donor, which accounts for 46% of all events at this position.

