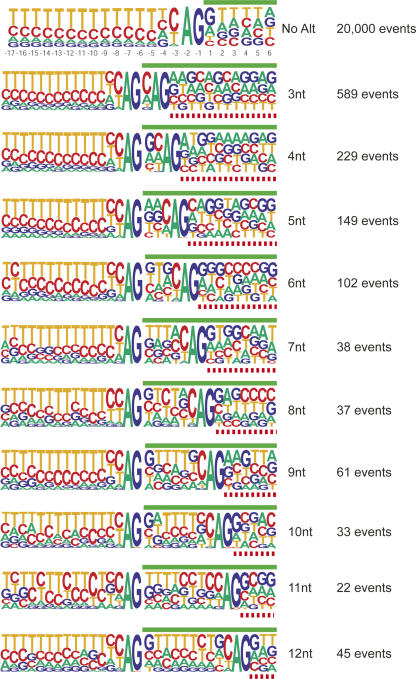
FIGURE 4.
Alignment of alternative downstream 3′-splice sites. Sequence comparison of constitutive 3′-splice sites (top) with alternative splice-site activation events at positions ranging from +3 to +12 nt from the dominant splice site. The green bars indicate exon sequences of the dominant splice site. The red dashed bars designate exon sequences of the alternative splice site. The numbers to the right indicated the sample size used to generate the sequence pictograms.

