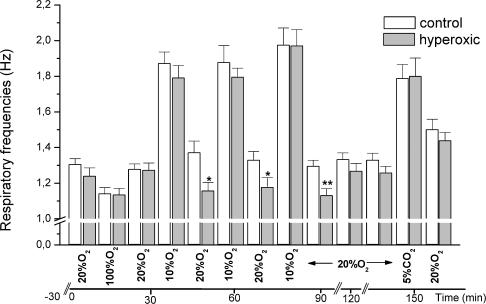
Figure 1. Modification of the respiratory frequencies induced by hyperoxia, hypoxia and hypercapnia in control and perinatally hyperoxic animals.
The animals were individually caged in the chambers of the plethysmograph that were flushed sequentially with the gas mixtures shown at the bottom of the graph while recording respiratory frequencies. The columns represent mean ±s.e.m. of 16 individual data. *P < 0.05; **P < 0.01.

