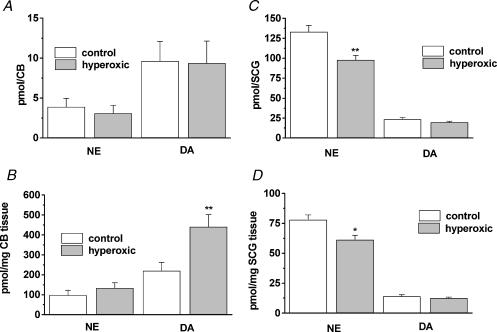
Figure 3. Content of catecholamines in CB and superior cervical ganglia of control and hyperoxic animals.
A and B correspond to CB levels of dopamine (DA) and norepinephrine (NE) expressed, respectively, as pmol per CB and as pmol per mg tissue. C and D, DA and NE levels in superior cervical ganglion (SCG). Data are mean ±s.e.m. of 14 control and 14 hyperoxic CB, and nine control and eight hyperoxic SCG. *P < 0.05; **P < 0.01.

