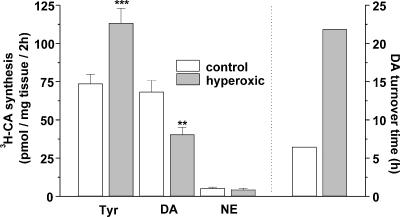
Figure 4. Rates of 3H-CA synthesis from the natural precursor 3H-tyrosine in CBs from control and hyperoxic rats.
The figure also shows the intracellular accumulation of free 3H-tyrosine. Data are expressed as pmol of 3H-DA and 3H-NE synthesized per mg of CB tissue in two hours. Data are mean ±s.e.m. and were obtained in 30 CBs from control animals and 28 CBs from hyperoxic animals. The right axis represents the calculated turnover time for DA in the control and hyperoxic CBs. The turnover time was calculated by dividing the DA content in the organ (data from Fig. 3; pmol per mg tissue) by the rate of synthesis (this figure, pmol per mg tissue per hour). **P < 0.01; ***P < 0.001.

