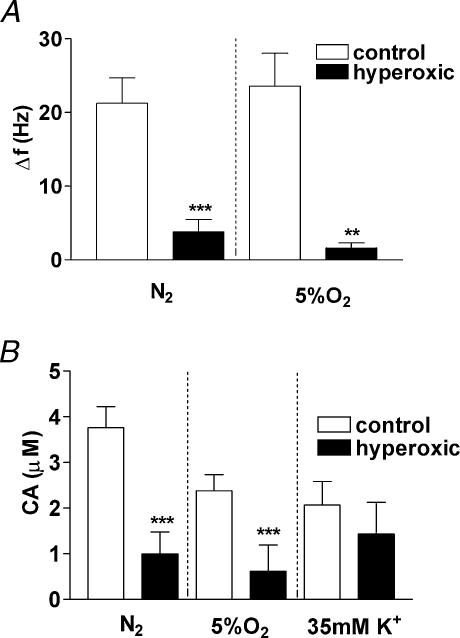
Figure 8. Responses to hypoxia and high external K+ in CB-CSN preparations from control and hyperoxic animals.
A, Δ frequencies (Hz; peak discharge during stimulation minus basal discharge prior to stimulation) while perfusing with N2 and 5% O2-equilibrated solutions. The data are mean ±s.e.m.; n= 32 and 29 for N2, control (white bars) and hyperoxic (black bars), respectively, and 22 and 28 for 5% (v/v) O2 control (white bars) and hyperoxic (black bars). B, mean CA concentrations (μm) registered in the CB tissue from control (white bars) and hyperoxic animals (black bars). For N2, n= 28 (control) and 18 (hyperoxic); for 5% (v/v) O2, n= 18 and 12 for control and hyperoxic CBs, respectively. For 35 mm K+n= 24 and 12 for control and hyperoxic CBs, respectively.

