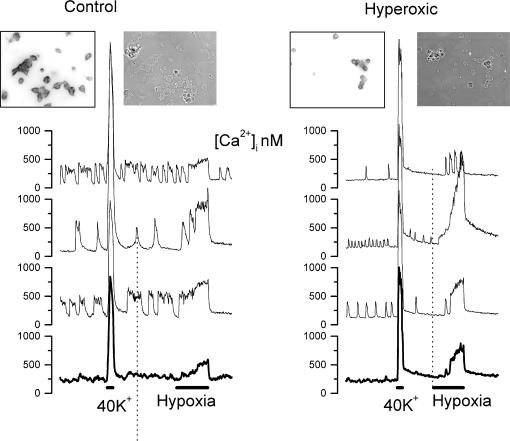
Figure 9. Intracellular Ca2+ responses to high external K+ and to hypoxia in chemoreceptor cells isolated from control and hyperoxic CBs.
Left part shows sample recordings obtained in three chemoreceptor cells of the microscope field (insets) and the lower trace is the response obtained in the entire field. Note the oscillatory behaviour of the intracellular Ca2+ levels in normoxia, the brisk increase in response to a short (30 s) pulse perfusion with 40 mm K+ and the moderate sustained increase elicited by perfusion with a hypoxic solution (PO2≈10 mmHg; 180 s). Right part shows an identical set of recordings obtained in a CB culture from hyperoxic animals. Note the greater variability of the response to hypoxia and the apparent slower onset of the response to hypoxia. The insets show phase contrast and tyrosine hydroxylase immunostaining of the dissociated CB tissue culture.

